Whitworth University, Adult Degree Programs : Overview, Courses, Scholarships & Rankings
About Whitworth University
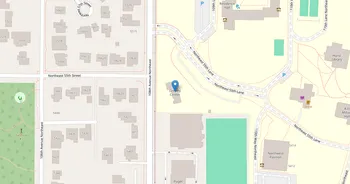
Locals know Whitworth's campus for its tall pines and brick paths, and the Adult Degree Programs fit that calm, focused setting. The university is known for a liberal arts foundation with strengths in applied fields working adults count on, taught by faculty who keep learning practical and discussion based. Students find flexible schedules, thoughtful advising, a strong library, tech help, writing support, and quiet places to dig in.
Campus life leans purposeful, with networking nights, workshops, and access to the rec center and outdoor study spots. The culture reflects a Christian tradition that prizes curiosity and respectful conversation. Career coaching links learning to Spokane employers in health care, education, nonprofit, and business. And the location makes it easy to pair class with riverfront arts, trails, and quick mountain escapes.
Key Institutional Details
Contact & Profile
Academic & Institutional
Degree Programs & Career Salary Prospects
Explore degree programs offered at Whitworth University, Adult Degree Programs with detailed career prospects, starting salary ranges, and job opportunities in Washington. See what you can do with your degree and expected earnings after graduation.
Liberal Arts (1)
Liberal Arts Education, General Studies and Humanities
24.0101
Liberal Arts and Sciences/Liberal Studies.
(Cert2y+)
Graduate Career Earnings in Washington
SOC Code | Occupation | US National | Washington Avg | WA vs US |
---|---|---|---|---|
25-1199 | Postsecondary Teachers, All Other | $94,470 | $90,960 | -$3,510 (-3.7%) |
Business (4)
Business Administration, Marketing and Entrepreneurship
52.0201
Business Administration and Management, General.
(Cert2y+)
Graduate Career Earnings in Washington
SOC Code | Occupation | US National | Washington Avg | WA vs US |
---|---|---|---|---|
11-1011 | Chief Executives | $262,930 | $199,360 | -$63,570 (-24.2%) |
11-1021 | General and Operations Managers | $133,120 | $128,860 | -$4,260 (-3.2%) |
11-2022 | Sales Managers | $160,930 | $159,250 | -$1,680 (-1%) |
11-3012 | Administrative Services Managers | $126,030 | $117,780 | -$8,250 (-6.5%) |
11-3013 | Facilities Managers | $114,520 | $111,100 | -$3,420 (-3%) |
11-3051 | Industrial Production Managers | $129,180 | $144,790 | +$15,610 (+12.1%) |
11-3071 | Transportation, Storage, and Distribution Managers | $116,010 | $111,260 | -$4,750 (-4.1%) |
11-3111 | Compensation and Benefits Managers | $156,230 | $222,140 | +$65,910 (+42.2%) |
11-3121 | Human Resources Managers | $160,480 | $147,560 | -$12,920 (-8.1%) |
11-3131 | Training and Development Managers | $140,590 | $131,800 | -$8,790 (-6.3%) |
11-9021 | Construction Managers | $119,660 | $153,140 | +$33,480 (+28%) |
11-9072 | Entertainment and Recreation Managers, Except Gambling | $87,060 | $96,920 | +$9,860 (+11.3%) |
11-9151 | Social and Community Service Managers | $86,100 | $97,640 | +$11,540 (+13.4%) |
11-9179 | Personal Service Managers, All Other | $70,620 | $80,210 | +$9,590 (+13.6%) |
11-9199 | Managers, All Other | $149,890 | $135,070 | -$14,820 (-9.9%) |
13-1051 | Cost Estimators | $83,160 | $83,030 | -$130 (-0.2%) |
13-1071 | Human Resources Specialists | $79,730 | $80,430 | +$700 (+0.9%) |
13-1081 | Logisticians | $87,600 | $86,040 | -$1,560 (-1.8%) |
13-1082 | Project Management Specialists | $108,100 | $104,340 | -$3,760 (-3.5%) |
13-1111 | Management Analysts | $114,710 | $103,670 | -$11,040 (-9.6%) |
13-1141 | Compensation, Benefits, and Job Analysis Specialists | $82,920 | $82,110 | -$810 (-1%) |
13-1199 | Business Operations Specialists, All Other | $92,380 | $84,490 | -$7,890 (-8.5%) |
25-1011 | Business Teachers, Postsecondary | $113,840 | $112,670 | -$1,170 (-1%) |
52.0205
Operations Management and Supervision.
(AltPostMSc)
Graduate Career Earnings in Washington
SOC Code | Occupation | US National | Washington Avg | WA vs US |
---|---|---|---|---|
11-3013 | Facilities Managers | $114,520 | $111,100 | -$3,420 (-3%) |
11-3021 | Computer and Information Systems Managers | $187,990 | $172,070 | -$15,920 (-8.5%) |
11-3051 | Industrial Production Managers | $129,180 | $144,790 | +$15,610 (+12.1%) |
11-9021 | Construction Managers | $119,660 | $153,140 | +$33,480 (+28%) |
13-1081 | Logisticians | $87,600 | $86,040 | -$1,560 (-1.8%) |
25-1011 | Business Teachers, Postsecondary | $113,840 | $112,670 | -$1,170 (-1%) |
49-1011 | First-Line Supervisors of Mechanics, Installers, and Repairers | $82,930 | $94,080 | +$11,150 (+13.4%) |
51-1011 | First-Line Supervisors of Production and Operating Workers | $74,540 | $68,530 | -$6,010 (-8.1%) |
52.0301
Accounting.
(AltPostMSc)
Graduate Career Earnings in Washington
SOC Code | Occupation | US National | Washington Avg | WA vs US |
---|---|---|---|---|
13-2011 | Accountants and Auditors | $93,520 | $86,320 | -$7,200 (-7.7%) |
13-2022 | Appraisers of Personal and Business Property | N/A | N/A | N/A |
13-2031 | Budget Analysts | $93,920 | $79,500 | -$14,420 (-15.4%) |
13-2041 | Credit Analysts | $98,040 | $97,720 | -$320 (-0.3%) |
13-2054 | Financial Risk Specialists | $119,930 | $90,540 | -$29,390 (-24.5%) |
13-2061 | Financial Examiners | $103,650 | $122,920 | +$19,270 (+18.6%) |
13-2081 | Tax Examiners and Collectors, and Revenue Agents | $67,570 | $87,790 | +$20,220 (+29.9%) |
13-2082 | Tax Preparers | $58,860 | $46,380 | -$12,480 (-21.2%) |
25-1011 | Business Teachers, Postsecondary | $113,840 | $112,670 | -$1,170 (-1%) |
52.0305
Accounting and Business/Management.
(Cert2y+)
Graduate Career Earnings in Washington
SOC Code | Occupation | US National | Washington Avg | WA vs US |
---|---|---|---|---|
11-3031 | Financial Managers | $180,470 | $157,350 | -$23,120 (-12.8%) |
13-2011 | Accountants and Auditors | $93,520 | $86,320 | -$7,200 (-7.7%) |
13-2022 | Appraisers of Personal and Business Property | N/A | N/A | N/A |
13-2051 | Financial and Investment Analysts | $116,490 | $96,080 | -$20,410 (-17.5%) |
13-2054 | Financial Risk Specialists | $119,930 | $90,540 | -$29,390 (-24.5%) |
25-1011 | Business Teachers, Postsecondary | $113,840 | $112,670 | -$1,170 (-1%) |
Education (3)
Educational Sciences, Teaching Methods and Pedagogy
13.0101
Education, General.
(Cert2y+)
Graduate Career Earnings in Washington
SOC Code | Occupation | US National | Washington Avg | WA vs US |
---|---|---|---|---|
25-1081 | Education Teachers, Postsecondary | $78,500 | $61,250 | -$17,250 (-22%) |
25-9042 | Teaching Assistants, Preschool, Elementary, Middle, and Secondary School, Except Special Education | N/A | N/A | N/A |
25-9043 | Teaching Assistants, Special Education | N/A | N/A | N/A |
13.1202
Elementary Education and Teaching.
(Cert2y+)
Graduate Career Earnings in Washington
SOC Code | Occupation | US National | Washington Avg | WA vs US |
---|---|---|---|---|
25-1081 | Education Teachers, Postsecondary | $78,500 | $61,250 | -$17,250 (-22%) |
25-2021 | Elementary School Teachers, Except Special Education | $69,790 | $84,650 | +$14,860 (+21.3%) |
13.1205
Secondary Education and Teaching.
(Cert2y+)
Graduate Career Earnings in Washington
SOC Code | Occupation | US National | Washington Avg | WA vs US |
---|---|---|---|---|
25-1081 | Education Teachers, Postsecondary | $78,500 | $61,250 | -$17,250 (-22%) |
25-2031 | Secondary School Teachers, Except Special and Career/Technical Education | $73,700 | $86,870 | +$13,170 (+17.9%) |
Agriculture (1)
Agricultural Sciences, Animal Husbandry and Veterinary Medicine
01.1003
Brewing Science.
(AltPostMSc)
Graduate Career Earnings in Washington
SOC Code | Occupation | US National | Washington Avg | WA vs US |
---|---|---|---|---|
19-1012 | Food Scientists and Technologists | $92,190 | $107,030 | +$14,840 (+16.1%) |
19-4013 | Food Science Technicians | $54,400 | $48,260 | -$6,140 (-11.3%) |
51-3092 | Food Batchmakers | $42,830 | $43,040 | +$210 (+0.5%) |
51-9012 | Separating, Filtering, Clarifying, Precipitating, and Still Machine Setters, Operators, and Tenders | $53,830 | $55,410 | +$1,580 (+2.9%) |
Tuition, Fees & Estimated Costs
Overview of tuition rates, housing, and other annual education expenses for undergraduate and graduate students
Financial Aid & Student Support
Summary of scholarships, grants, student loans, and financial aid statistics for undergraduate students
Student Success Metrics
Graduation rates and post-graduation earnings to help assess student outcomes and long-term value of education.
Loan Burden & Repayment Outcomes
Breakdown of loan repayment rates and student debt levels by income and dependency status.
Frequently Asked Questions
Find answers to the most common questions about Whitworth University, Adult Degree Programs
How much does it cost to attend Whitworth University, Adult Degree Programs?
The annual tuition at Whitworth University, Adult Degree Programs is $13,560 for in-state students. When including room and board, books, and other expenses, the total estimated cost is approximately $13,560 for in-state students.
Data based on IPEDS program completions for 2022-2023 academic year. Tuition and cost estimates are approximate and may not include all fees, personal expenses, or transportation costs.
What academic programs and degree levels does Whitworth University, Adult Degree Programs offer?
Whitworth University, Adult Degree Programs offers 11 academic programs across 4 major fields of study, with available degree levels: Bachelor's, Other Award.
Most popular program areas include:
- Business Administration, Marketing and Entrepreneurship (4 programs)
- Educational Sciences, Teaching Methods and Pedagogy (3 programs)
- Agricultural Sciences, Animal Husbandry and Veterinary Medicine (1 programs)
- Liberal Arts Education, General Studies and Humanities (1 programs)
Data based on IPEDS program completions for 2022-2023 academic year. Numbers reflect programs where students graduated, not all offered programs.
What is the average salary for Whitworth University, Adult Degree Programs graduates?
Whitworth University, Adult Degree Programs graduates earn a median salary of $49,510 after 6 years and $58,561 after 10 years.
The salary range 10 years after graduation spans from $38,934 (25th percentile) to $80,121 (75th percentile), with top earners reaching $81,600 (90th percentile).
Data based on IPEDS for 2022-2023 academic year. Salary data reflects graduates who received federal financial aid (approximately 60% of all graduates). Actual earnings may vary significantly based on program, location, and individual circumstances.
Related Universities