UnisHub University Compass

Fox College : Overview, Courses, Scholarships & Rankings

0 · 0 reviews

About Fox College

Fox College in Tinley Park has a reputation for career-centered learning that moves at a steady, get-it-done pace. Focused classes stress practical skills across applied fields, backed by hands-on labs and tech-equipped rooms. Students count on tutoring, advising, and a helpful front desk. The campus is compact, with quiet study nooks, commuter-friendly parking, and spots to refuel between labs.

Student life is low-key but active: professional clubs, service projects, and short workshops that fit real schedules. The culture is grounded and welcoming; you can feel it, with recent grads alongside career changers who bring life experience to class. Career services is close by with resume help and interview prep. And the south suburban setting keeps internships nearby, with Chicago close enough for a quick reset.

Key Institutional Details

Contact & Profile

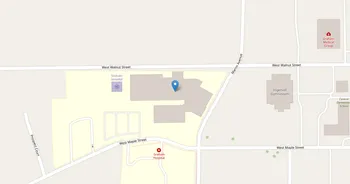
Location: 18020 Oak Park Avenue, Tinley Park, Illinois, 60477, USA
Unit ID: 145239

Academic & Institutional

Control: Private for-profit institution (operates for revenue)
Accreditation: HLC
Length of Study: Programs of 2 to less than 4 years (e.g. associate degree)
Calendar System: Semester system (two main terms per year)
Award Levels: Associate's
Carnegie Classification: Doctoral Universities: Very High Research Associate's - High Career & Technical, Mixed
Campus Setting: Located in a large suburb (outside principal city, 250,000+ population)
Tuition: In-state: $15,720 · Out-of-state: $15,720
Student Profile:
Total Students: 239
Undergraduate: 239
Graduate/Other: 0
Male: 48 Female: 191
Applications:
Total Applicants: 64
Admitted: 49
Enrolled: 27
Acceptance: 76.6% Yield: 55.1%
Staff:
Total: 44 Full-time: 36 Part-time: 8

Degree Programs & Career Salary Prospects

Explore degree programs offered at Fox College with detailed career prospects, starting salary ranges, and job opportunities in Illinois. See what you can do with your degree and expected earnings after graduation.

How to use this guide:
Click on any academic field that interests you to expand and view available degree programs. Each program shows potential career paths, median salaries in Illinois vs national averages, and job prospects for graduates. Perfect for answering "What can I do with my degree?" and salary expectations.
Agriculture (1)
Agricultural Sciences, Animal Husbandry and Veterinary Medicine
01.8301 Veterinary/Animal Health Technology/Technician and Veterinary Assistant. (Cert<2y)
A program that prepares individuals, under the supervision of veterinarians, laboratory animal specialists, and zoological professionals, to provide patient management, care, and clinical procedures assistance as well as owner communication. Includes instruction in animal nursing care, animal health and nutrition, animal handling, clinical pathology, radiology, anesthesiology, dental prophylaxis, surgical assisting, clinical laboratory procedures, office administration skills, patient and owner management, and applicable standards and regulations.

Graduate Career Earnings in Illinois

Average graduate salary for this degree:
SOC Code Occupation US National Illinois Avg IL vs US
25-1071 Health Specialties Teachers, Postsecondary $137,900 $96,300 -$41,600 (-30.2%)
29-2056 Veterinary Technologists and Technicians $46,280 $40,350 -$5,930 (-12.8%)
31-9096 Veterinary Assistants and Laboratory Animal Caretakers $38,990 $34,540 -$4,450 (-11.4%)
Health (3)
Healthcare Professions, Medical Sciences and Clinical Practice
51.0801 Medical/Clinical Assistant. (Cert<2y)
A program that prepares individuals, under the supervision of physicians, to provide medical office administrative services and perform clinical duties including patient intake and care, routine diagnostic and recording procedures, pre-examination and examination assistance, and the administration of medications and first aid. Includes instruction in basic anatomy and physiology; medical terminology; medical law and ethics; patient psychology and communications; medical office procedures; and clinical diagnostic, examination, testing, and treatment procedures.

Graduate Career Earnings in Illinois

Average graduate salary for this degree:
SOC Code Occupation US National Illinois Avg IL vs US
25-1071 Health Specialties Teachers, Postsecondary $137,900 $96,300 -$41,600 (-30.2%)
31-9092 Medical Assistants $44,720 $41,230 -$3,490 (-7.8%)
51.0803 Occupational Therapist Assistant. (Cert<2y)
A program that prepares individuals, under the supervision of occupational therapists, to direct patient participation in skill-enhancing, learning, and motivational tasks; correct or diminish pathologies; and to provide direct health education and promotion services. Includes instruction in human life span development, occupational therapy principles and practice skills, treatment planning and implementation, record-keeping and documentation, patient education and intervention, activity and program direction, and assistive services management.

Graduate Career Earnings in Illinois

Average graduate salary for this degree:
SOC Code Occupation US National Illinois Avg IL vs US
25-1071 Health Specialties Teachers, Postsecondary $137,900 $96,300 -$41,600 (-30.2%)
31-2011 Occupational Therapy Assistants $68,540 $60,320 -$8,220 (-12%)
51.0806 Physical Therapy Assistant. (Cert<2y)
A program that prepares individuals, under the supervision of a physical therapist, to implement physical therapy treatment care plans, train patients, conduct treatment interventions, use equipment, and observe and record patient progress. Includes instruction in applied anatomy and physiology, behavioral sciences, biomechanics, clinical documentation, clinical pathology, communication, exercise physiology, kinesiology, neuroscience, and professional standards and ethics.

Graduate Career Earnings in Illinois

Average graduate salary for this degree:
SOC Code Occupation US National Illinois Avg IL vs US
31-2021 Physical Therapist Assistants $67,160 $62,300 -$4,860 (-7.2%)

Tuition, Fees & Estimated Costs

Overview of tuition rates, housing, and other annual education expenses for undergraduate and graduate students

Estimated Total Cost
(In-state)
$17,470
Estimated Total Cost
(Out-state)
$17,470
In-state Tuition (incl. fees)
$15,720
Tuition and fees for students residing in-state
Out-of-state Tuition (incl. fees)
$15,720
Tuition and fees for non-resident students
Room & Board
$6,200 (off-campus)
Housing and meal plan expenses
Books & Supplies
$1,750
Average yearly cost of books and study materials
Other Expenses
$1,258 (off-campus)
Miscellaneous personal and institutional expenses
Other Expenses (with family)
$1,658
Estimated cost for students living with family
Graduate In-state Tuition (incl. fees)
N/A
Graduate tuition rates for in-state students
Graduate Out-of-state Tuition (incl. fees)
N/A
Graduate tuition rates for non-resident students

Financial Aid & Student Support

Summary of scholarships, grants, student loans, and financial aid statistics for undergraduate students

6%
FTFT Aid Recipients
Avg. Grant
$11,380
Avg. Loan
$6,369
Avg. Federal Loan
$5,103
Additional
Students with Any Grant
10
Students who received any type of grant aid
Students with Any Loan
10
Students who received any type of loan-based aid
Students with Federal Grant
10
Students who received a federal grant
Avg. Institutional Grant
N/A
Average amount of institutional grant awarded

Student Success Metrics

Graduation rates and post-graduation earnings to help assess student outcomes and long-term value of education.

N/A
Graduation Rate
Percentage of students who successfully graduate from the institution
N/A
First-Year Retention Rate
Percentage of first-year students who continue for a second year
Median Earnings Over Time
$25,745 – $58,293
Salary Range (25th–75th Percentile, 10 Years)
$25,745 (25th %) $58,293 (75th %)
*Median Salary After 10 Years: $41,539
Median Salary After 6 Years
$40,654
Average annual earnings of former students six years after starting college.
Median Salary After 10 Years
$41,539
Average annual earnings of former students ten years after starting college.

Loan Burden & Repayment Outcomes

Breakdown of loan repayment rates and student debt levels by income and dependency status.

3-Year Loan Repayment Rate
72.4%
Share of borrowers who repaid loans within 3 years
Repayment Rate (Graduates Only)
80.9%
Repayment rate among students who completed their program
Median Student Loan Debt
$16,209
Median federal loan debt of undergraduate completers at time of graduation.
Repayment by Income
Low 65.2%
Middle 77.7%
High 86.2%
Repayment by Dependency
Dependent 76.0%
Independent 68.0%

Frequently Asked Questions

Find answers to the most common questions about Fox College

How much does it cost to attend Fox College?

The annual tuition at Fox College is $15,720 for in-state students. When including room and board, books, and other expenses, the total estimated cost is approximately $17,470 for in-state students. Additional costs include room and board $6,200 (off-campus) and books and supplies $1,750.

Data based on IPEDS program completions for 2022-2023 academic year. Tuition and cost estimates are approximate and may not include all fees, personal expenses, or transportation costs.

What academic programs and degree levels does Fox College offer?

Fox College offers 5 academic programs across 2 major fields of study, with available degree levels: Associate's.

Most popular program areas include:

  • Healthcare Professions, Medical Sciences and Clinical Practice (3 programs)
  • Agricultural Sciences, Animal Husbandry and Veterinary Medicine (1 programs)

Data based on IPEDS program completions for 2022-2023 academic year. Numbers reflect programs where students graduated, not all offered programs.

What is the acceptance rate for Fox College?

Fox College has an 76.6% acceptance rate and a 55.1% yield rate, making it selective.

Admission statistics breakdown:

  • Total applicants: 64
  • Students admitted: 49
  • Students enrolled: 27

Data based on IPEDS for 2022-2023 academic year. Admission statistics may vary by program and application cycle.

What financial aid and scholarships are available at Fox College?

Fox College provides financial aid to 6% of first-time, full-time students, with average grants of $11,380 and average loans of $6,369.

Average financial aid amounts by type:

  • Pell grants: $5,485
  • State/Local grants: $7,200
  • Federal loans: $5,103

The university supports 10 students with grants and 10 students with loans annually.

Data based on IPEDS for 2022-2023 academic year. Financial aid amounts and percentages may vary by program, enrollment status, and individual circumstances.

What is the average salary for Fox College graduates?

Fox College graduates earn a median salary of $40,654 after 6 years and $41,539 after 10 years.

The salary range 10 years after graduation spans from $25,745 (25th percentile) to $58,293 (75th percentile), with top earners reaching $60,400 (90th percentile).

Data based on IPEDS for 2022-2023 academic year. Salary data reflects graduates who received federal financial aid (approximately 60% of all graduates). Actual earnings may vary significantly based on program, location, and individual circumstances.

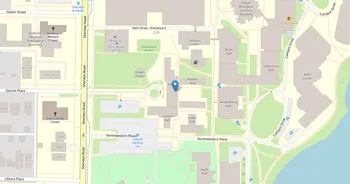
Campus map for Garrett-Evangelical Theological Seminary
Garrett-Evangelical Theological Seminary
2121 Sheridan Road, Evanston, IL 60201-3298
View Profile
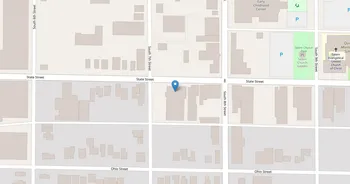
Campus map for Gem City College
Gem City College
700 State St, Quincy, IL 62301
View Profile
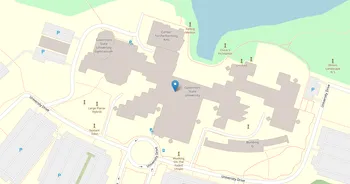
Campus map for Governors State University
Governors State University
1 University Pky, University Park, IL 60484
View Profile