Stanbridge University : Overview, Courses, Scholarships & Rankings
About Stanbridge University
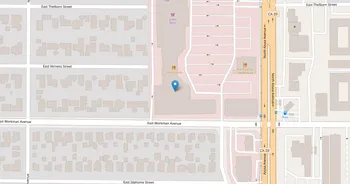
Set in Irvine, Stanbridge University is known for practical, hands-on learning across the health sciences, animal care, and technology. Classes combine clear theory with lab work in realistic simulation spaces, supported by quiet study areas, a learning hub, and student services that help you keep momentum. The atmosphere is focused and collaborative, the kind of place where classmates trade know-how after labs and stick around for workshops and tutoring.
Student life feels purposeful but not stiff. You'll find student groups, community service, and easy access to parks, trails, and nearby beaches when it's time to recharge. Career preparation starts early through skills coaching, field and clinical experiences, and ties to local employers and professional groups. The culture leans service minded and professional, with milestone ceremonies that mark the move into a career. It's a grounded, get-it-done campus with room to breathe.
Key Institutional Details
Contact & Profile
Academic & Institutional
Academic Programs & Fields of Study
Stanbridge University offers 6 degree programs across 2 major academic fields, graduating approximately 548 students annually. The most popular fields by graduate volume are Health (5 programs, 531 graduates) and Agriculture (1 programs, 17 graduates). Explore program details, award levels, and graduate demographics below.
Health (5 programs, 531 graduates)
Healthcare Professions, Medical Sciences and Clinical Practice
| Program Name | Graduates | Gender Distribution | Award Levels | CIP Code |
|---|---|---|---|---|
| Licensed Practical Nursing | 258 |
|
Certificate (≥2 yrs)
Associate's
|
51.3901 |
| Occupational Therapy | 87 |
|
Master's
|
51.2306 |
| Registered Nursing | 84 |
|
Bachelor's
Master's
|
51.3801 |
| Occupational Therapy Assistant | 52 |
|
Associate's
|
51.0803 |
| Physical Therapy Assistant | 50 |
|
Associate's
|
51.0806 |
Agriculture (1 programs, 17 graduates)
Agricultural Sciences, Animal Husbandry and Veterinary Medicine
| Program Name | Graduates | Gender Distribution | Award Levels | CIP Code |
|---|---|---|---|---|
| Veterinary Technology and Animal Health Assistant | 17 |
|
Associate's
|
01.8301 |
Admission Requirements & Test Scores
Comprehensive overview of admission criteria, standardized test score ranges, and application requirements for prospective students at Stanbridge University.
Application Requirements
Data based on IPEDS for 2022-2023 academic year. Test score ranges represent the middle 50% of admitted students (25th-75th percentile). Requirements may vary by program.
Tuition, Fees & Estimated Costs
Overview of tuition rates, housing, and other annual education expenses for undergraduate and graduate students
Financial Aid & Student Support
Summary of scholarships, grants, student loans, and financial aid statistics for undergraduate students
Student Success Metrics
Graduation rates and post-graduation earnings to help assess student outcomes and long-term value of education.
Loan Burden & Repayment Outcomes
Breakdown of loan repayment rates and student debt levels by income and dependency status.
Frequently Asked Questions
Find answers to the most common questions about Stanbridge University
What academic programs and degree levels does Stanbridge University offer?
Stanbridge University offers 6 academic programs across 2 major fields of study, with available degree levels: Certificate (≥2 yrs), Associate's, Bachelor's, Master's.
Most popular program areas include:
- Healthcare Professions, Medical Sciences and Clinical Practice (5 programs)
- Agricultural Sciences, Animal Husbandry and Veterinary Medicine (1 programs)
Data based on IPEDS program completions for 2023-2024 academic year. Numbers reflect programs where students graduated, not all offered programs.
What is the acceptance rate for Stanbridge University?
Stanbridge University has an 11.4% acceptance rate and a 95.8% yield rate, making it highly selective.
Admission statistics breakdown:
- Total applicants: 2,700
- Students admitted: 307
- Students enrolled: 294
Data based on IPEDS for 2022-2023 academic year. Admission statistics may vary by program and application cycle.
What financial aid and scholarships are available at Stanbridge University?
Stanbridge University provides financial aid to 32% of first-time, full-time students, with average grants of $4,341 and average loans of $11,598.
Average financial aid amounts by type:
- Pell grants: $3,984
- State/Local grants: $10,294
- Institutional grants: $3,000
- Federal loans: $6,805
The university supports 465 students with grants and 655 students with loans annually.
Data based on IPEDS for 2022-2023 academic year. Financial aid amounts and percentages may vary by program, enrollment status, and individual circumstances.
What is the average salary for Stanbridge University graduates?
Stanbridge University graduates earn a median salary of $53,729 after 6 years and $62,144 after 10 years.
The salary range 10 years after graduation spans from $36,562 (25th percentile) to $87,057 (75th percentile).
Data based on IPEDS for 2022-2023 academic year. Salary data reflects graduates who received federal financial aid (approximately 60% of all graduates). Actual earnings may vary significantly based on program, location, and individual circumstances.
Related Universities


Found something useful? Help others discover it too! Share with friends, on social media, or save for later - every share helps someone find the information they need.