Norwich University : Overview, Courses, Scholarships & Rankings
About Norwich University
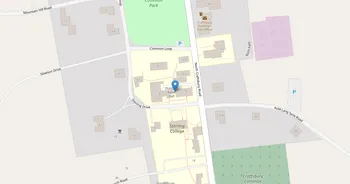
Tucked into a Green Mountain valley, Norwich University is known for pairing a disciplined Corps of Cadets with a welcoming civilian community. Academics lean practical across sciences, leadership and public service, business, and the liberal arts. Modern labs, a well stocked library, and maker-style spaces back the hands on approach, while advising, tutoring, counseling, and health care keep students supported.
Life here mixes structure with classic college energy. Ceremonies on the parade ground share space with clubs, intramurals, the fitness center, and outdoor adventures on nearby trails, rivers, and winter snow. Career preparation favors real experience, with internships and an alumni network tied to defense, government, and industry. Northfield adds small town Vermont warmth, local partnerships, and plenty of chances to pitch in.
Key Institutional Details
Contact & Profile
Academic & Institutional
Academic Programs & Fields of Study
Norwich University offers 48 degree programs across 21 major academic fields, graduating approximately 1,002 students annually. The most popular fields by graduate volume are Military Tech (1 programs, 142 graduates), Health (6 programs, 140 graduates), Security & Safety (1 programs, 128 graduates), Business (7 programs, 127 graduates) and Computer & IT (3 programs, 117 graduates). Explore program details, award levels, and graduate demographics below.
Military Tech (1 programs, 142 graduates)
Defense Technologies and Advanced Military Systems
| Program Name | Graduates | Gender Distribution | Award Levels | CIP Code |
|---|---|---|---|---|
| Intelligence Studies | 142 |
|
Bachelor's
Master's
|
29.0201 |
Health (6 programs, 140 graduates)
Healthcare Professions, Medical Sciences and Clinical Practice
| Program Name | Graduates | Gender Distribution | Award Levels | CIP Code |
|---|---|---|---|---|
| Registered Nursing | 56 |
|
Bachelor's
|
51.3801 |
| Health Administration and Management | 53 |
|
Master's
|
51.0701 |
| Psychiatric and Mental Health Nursing | 26 |
|
Post-Master's
|
51.3810 |
| Athletic Training | 2 |
|
Master's
|
51.0913 |
| Family Practice Nursing | 2 |
|
Post-Master's
|
51.3805 |
| Geriatric Nursing | 1 |
|
Post-Master's
|
51.3821 |
Security & Safety (1 programs, 128 graduates)
Emergency Management, Law Enforcement and Public Safety
| Program Name | Graduates | Gender Distribution | Award Levels | CIP Code |
|---|---|---|---|---|
| Criminal Justice Administration | 128 |
|
Bachelor's
Master's
|
43.0103 |
Business (7 programs, 127 graduates)
Business Administration, Marketing and Entrepreneurship
| Program Name | Graduates | Gender Distribution | Award Levels | CIP Code |
|---|---|---|---|---|
| Business Administration and Management | 80 |
|
Bachelor's
Master's
|
52.0201 |
| Organizational Leadership | 19 |
|
Master's
|
52.0213 |
| Construction Management | 14 |
|
Bachelor's
|
52.2001 |
| International Business and Trade | 8 |
|
Bachelor's
|
52.1101 |
| Accounting | 4 |
|
Bachelor's
Master's
|
52.0301 |
| Management Information Systems | 1 |
|
Master's
|
52.1201 |
| Management Science | 1 |
|
Master's
|
52.1301 |
Computer & IT (3 programs, 117 graduates)
Computer Science, Information Technology and Cybersecurity
| Program Name | Graduates | Gender Distribution | Award Levels | CIP Code |
|---|---|---|---|---|
| Information Science | 58 |
|
Bachelor's
Postbac Cert.
Master's
|
11.0401 |
| Information Systems Security and Auditing | 42 |
|
Bachelor's
|
11.1003 |
| Computer Science | 17 |
|
Bachelor's
|
11.0701 |
Social Sciences (5 programs, 93 graduates)
Sociology, Anthropology and Political Science Studies
| Program Name | Graduates | Gender Distribution | Award Levels | CIP Code |
|---|---|---|---|---|
| International Relations | 39 |
|
Master's
|
45.0901 |
| National Security Policy | 30 |
|
Bachelor's
|
45.0902 |
| Political Science and Government | 11 |
|
Bachelor's
|
45.1001 |
| International Relations and National Security | 7 |
|
Bachelor's
|
45.0999 |
| Criminology | 6 |
|
Bachelor's
|
45.0401 |
Engineering (4 programs, 61 graduates)
Engineering Sciences and Applied Technology Solutions
| Program Name | Graduates | Gender Distribution | Award Levels | CIP Code |
|---|---|---|---|---|
| Mechanical Engineering | 26 |
|
Bachelor's
|
14.1901 |
| Civil Engineering | 23 |
|
Bachelor's
Master's
|
14.0801 |
| Computer Engineering | 9 |
|
Bachelor's
|
14.0901 |
| General Engineering | 3 |
|
Bachelor's
|
14.0101 |
History (2 programs, 54 graduates)
Historical Studies, Cultural Heritage and Archaeological Research
| Program Name | Graduates | Gender Distribution | Award Levels | CIP Code |
|---|---|---|---|---|
| History | 29 |
|
Bachelor's
Master's
|
54.0101 |
| Military History | 25 |
|
Master's
|
54.0108 |
Architecture (1 programs, 24 graduates)
Architectural Design and Construction Planning Services
| Program Name | Graduates | Gender Distribution | Award Levels | CIP Code |
|---|---|---|---|---|
| Architecture | 24 |
|
Bachelor's
Master's
|
04.0201 |
Psychology (1 programs, 22 graduates)
Psychological Sciences, Mental Health and Behavioral Studies
| Program Name | Graduates | Gender Distribution | Award Levels | CIP Code |
|---|---|---|---|---|
| General Psychology | 22 |
|
Bachelor's
|
42.0101 |
Admission Requirements & Test Scores
Comprehensive overview of admission criteria, standardized test score ranges, and application requirements for prospective students at Norwich University.
Application Requirements
Data based on IPEDS for 2022-2023 academic year. Test score ranges represent the middle 50% of admitted students (25th-75th percentile). Requirements may vary by program.
Tuition, Fees & Estimated Costs
Overview of tuition rates, housing, and other annual education expenses for undergraduate and graduate students
Financial Aid & Student Support
Summary of scholarships, grants, student loans, and financial aid statistics for undergraduate students
Student Success Metrics
Graduation rates and post-graduation earnings to help assess student outcomes and long-term value of education.
Loan Burden & Repayment Outcomes
Breakdown of loan repayment rates and student debt levels by income and dependency status.
Frequently Asked Questions
Find answers to the most common questions about Norwich University
How much does it cost to attend Norwich University?
The annual tuition at Norwich University is $49,600 for in-state students. When including room and board, books, and other expenses, the total estimated cost is approximately $67,860 for in-state students. Additional costs include room and board $14,000 (on) / $15,800 (off) and books and supplies $1,500.
Data based on IPEDS program completions for 2022-2023 academic year. Tuition and cost estimates are approximate and may not include all fees, personal expenses, or transportation costs.
What academic programs and degree levels does Norwich University offer?
Norwich University offers 48 academic programs across 21 major fields of study, with available degree levels: Bachelor's, Postbac Cert., Master's, Post-Master's.
Most popular program areas include:
- Defense Technologies and Advanced Military Systems (1 programs)
- Healthcare Professions, Medical Sciences and Clinical Practice (6 programs)
- Emergency Management, Law Enforcement and Public Safety (1 programs)
- Business Administration, Marketing and Entrepreneurship (7 programs)
- Computer Science, Information Technology and Cybersecurity (3 programs)
Data based on IPEDS program completions for 2023-2024 academic year. Numbers reflect programs where students graduated, not all offered programs.
What is the acceptance rate for Norwich University?
Norwich University has an 73.6% acceptance rate and a 14.8% yield rate, making it selective.
Admission statistics breakdown:
- Total applicants: 5,157
- Students admitted: 3,796
- Students enrolled: 563
Data based on IPEDS for 2022-2023 academic year. Admission statistics may vary by program and application cycle.
What financial aid and scholarships are available at Norwich University?
Norwich University provides financial aid to 19% of first-time, full-time students, with average grants of $36,911 and average loans of $8,770.
Average financial aid amounts by type:
- Pell grants: $5,071
- State/Local grants: $2,833
- Institutional grants: $34,591
- Federal loans: $5,404
The university supports 543 students with grants and 337 students with loans annually.
Data based on IPEDS for 2022-2023 academic year. Financial aid amounts and percentages may vary by program, enrollment status, and individual circumstances.
What is the average salary for Norwich University graduates?
Norwich University graduates earn a median salary of $59,743 after 6 years and $65,575 after 10 years.
The salary range 10 years after graduation spans from $42,747 (25th percentile) to $86,999 (75th percentile).
Data based on IPEDS for 2022-2023 academic year. Salary data reflects graduates who received federal financial aid (approximately 60% of all graduates). Actual earnings may vary significantly based on program, location, and individual circumstances.
Related Universities


Found something useful? Help others discover it too! Share with friends, on social media, or save for later - every share helps someone find the information they need.