Quinnipiac University (QU) : Overview, Courses, Scholarships & Rankings
About Quinnipiac University
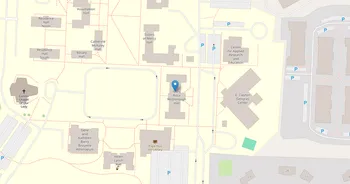
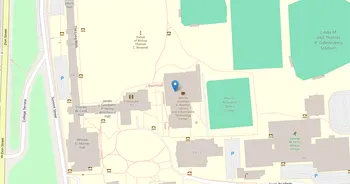
Framed by wooded ridgelines, the campus feels tucked away yet connected. Quinnipiac is known for practical, faculty-guided learning in health, business, media, computing, and the arts and sciences. Modern labs, studios, and libraries pair with tutoring, advising, wellness care, and a career center that sticks with you. The culture is collaborative and spirited, the kind where people say hi even if they only kind of know you.
Student life runs full tilt: active clubs, student media, service projects, intramurals, fitness centers, and an arena that comes alive on hockey nights. Trails nearby turn quick hikes into a daily habit. Career prep leans on the region, with New Haven close and the New York corridor within reach for internships and networking. And the widely cited Quinnipiac University Poll, plus proud blue-and-gold traditions, give the place a distinct voice you can feel as soon as you step on the quad.
Key Institutional Details
Contact & Profile
Academic & Institutional
Academic Programs & Fields of Study
Quinnipiac University (QU) offers 79 degree programs across 24 major academic fields, graduating approximately 2,909 students annually. The most popular fields by graduate volume are Health (19 programs, 1,074 graduates), Business (9 programs, 615 graduates), Communication (5 programs, 203 graduates), Education (6 programs, 150 graduates) and Arts (4 programs, 122 graduates). Explore program details, award levels, and graduate demographics below.
Health (19 programs, 1,074 graduates)
Healthcare Professions, Medical Sciences and Clinical Practice
| Program Name | Graduates | Gender Distribution | Award Levels | CIP Code |
|---|---|---|---|---|
| Health Professions and Related Sciences | 283 |
|
Bachelor's
|
51.9999 |
| Registered Nursing | 278 |
|
Bachelor's
|
51.3801 |
| Occupational Therapy | 106 |
|
Master's
Doctorate (P)
|
51.2306 |
| Medicine | 93 |
|
Doctorate (P)
|
51.1201 |
| Physical Therapy | 59 |
|
Doctorate (P)
|
51.2308 |
| Nursing Practice | 52 |
|
Doctorate (P)
|
51.3818 |
| Physician Assistant | 51 |
|
Master's
|
51.0912 |
| Pathology Assistant | 28 |
|
Master's
|
51.0811 |
| Athletic Training | 28 |
|
Bachelor's
|
51.0913 |
| Family Practice Nursing | 23 |
|
Master's
|
51.3805 |
| Radiologic Technology | 18 |
|
Bachelor's
Postbac Cert.
|
51.0911 |
| Nursing Administration | 16 |
|
Master's
|
51.3802 |
| Adult Health Nursing | 12 |
|
Master's
|
51.3803 |
| Diagnostic Medical Sonography | 10 |
|
Bachelor's
|
51.0910 |
| Perfusion Technology | 8 |
|
Master's
|
51.0906 |
| Allied Health Diagnostic and Treatment Professions | 4 |
|
Master's
|
51.0999 |
| Radiologist Assistant | 2 |
|
Master's
|
51.0814 |
| Health Humanities | 2 |
|
Bachelor's
|
51.3204 |
| Magnetic Resonance Imaging Technology | 1 |
|
Postbac Cert.
|
51.0920 |
Business (9 programs, 615 graduates)
Business Administration, Marketing and Entrepreneurship
| Program Name | Graduates | Gender Distribution | Award Levels | CIP Code |
|---|---|---|---|---|
| Business Administration and Management | 302 |
|
Bachelor's
Master's
|
52.0201 |
| Finance, General | 105 |
|
Bachelor's
|
52.0801 |
| Marketing Management | 80 |
|
Bachelor's
|
52.1401 |
| Accounting | 52 |
|
Bachelor's
Master's
|
52.0301 |
| Entrepreneurship Studies | 19 |
|
Bachelor's
|
52.0701 |
| Logistics and Supply Chain Management | 17 |
|
Bachelor's
|
52.0203 |
| Organizational Leadership | 15 |
|
Master's
|
52.0213 |
| Human Resources Management | 13 |
|
Bachelor's
|
52.1001 |
| International Business and Trade | 12 |
|
Bachelor's
Other Award
|
52.1101 |
Communication (5 programs, 203 graduates)
Media Communications, Journalism and Public Relations
| Program Name | Graduates | Gender Distribution | Award Levels | CIP Code |
|---|---|---|---|---|
| Public Relations and Image Management | 58 |
|
Bachelor's
Master's
|
09.0902 |
| Journalism | 55 |
|
Bachelor's
Master's
|
09.0401 |
| Mass Communication and Media Studies | 47 |
|
Bachelor's
|
09.0102 |
| Digital Media and Multimedia | 29 |
|
Master's
|
09.0702 |
| Public Relations and Advertising | 14 |
|
Bachelor's
|
09.0999 |
Education (6 programs, 150 graduates)
Educational Sciences, Teaching Methods and Pedagogy
| Program Name | Graduates | Gender Distribution | Award Levels | CIP Code |
|---|---|---|---|---|
| Educational Leadership and Administration | 50 |
|
Post-Master's
|
13.0401 |
| Elementary Education | 39 |
|
Master's
|
13.1202 |
| Special Education Teaching | 25 |
|
Postbac Cert.
Master's
|
13.1001 |
| Secondary Education and Teaching | 19 |
|
Master's
|
13.1205 |
| Instructional Technology | 16 |
|
Postbac Cert.
Master's
|
13.0501 |
| Education, General | 1 |
|
Postbac Cert.
|
13.9999 |
Arts (4 programs, 122 graduates)
Fine Arts, Design Studies and Creative Performance
| Program Name | Graduates | Gender Distribution | Award Levels | CIP Code |
|---|---|---|---|---|
| Cinematography and Film Production | 78 |
|
Bachelor's
Master's
|
50.0602 |
| Graphic Design | 25 |
|
Bachelor's
|
50.0409 |
| Game and Interactive Media Design | 12 |
|
Bachelor's
|
50.0411 |
| Theatre Arts | 7 |
|
Bachelor's
|
50.0501 |
Law (1 programs, 115 graduates)
Legal Studies, Jurisprudence and Professional Law Practice
| Program Name | Graduates | Gender Distribution | Award Levels | CIP Code |
|---|---|---|---|---|
| Law | 115 |
|
Doctorate (P)
|
22.0101 |
Biological Sciences (5 programs, 115 graduates)
Life Sciences, Biotechnology and Biomedical Research
| Program Name | Graduates | Gender Distribution | Award Levels | CIP Code |
|---|---|---|---|---|
| Biomedical Sciences | 40 |
|
Bachelor's
Master's
|
26.0102 |
| Biology and Biological Sciences | 37 |
|
Bachelor's
|
26.0101 |
| Cell and Molecular Biology | 27 |
|
Master's
|
26.0406 |
| Biochemistry | 8 |
|
Bachelor's
|
26.0202 |
| Microbiology and Immunology | 3 |
|
Bachelor's
|
26.0508 |
Psychology (2 programs, 97 graduates)
Psychological Sciences, Mental Health and Behavioral Studies
| Program Name | Graduates | Gender Distribution | Award Levels | CIP Code |
|---|---|---|---|---|
| General Psychology | 79 |
|
Bachelor's
|
42.0101 |
| Behavioral Neuroscience | 18 |
|
Bachelor's
|
42.2706 |
Interdisciplinary (4 programs, 79 graduates)
Cross-Disciplinary Studies and Integrated Research Programs
| Program Name | Graduates | Gender Distribution | Award Levels | CIP Code |
|---|---|---|---|---|
| Business Analytics | 69 |
|
Bachelor's
Master's
|
30.7102 |
| Data Science | 4 |
|
Bachelor's
|
30.7001 |
| Gerontology | 3 |
|
Bachelor's
|
30.1101 |
| Intercultural and Diversity Studies | 3 |
|
Other Award
|
30.2301 |
Social Sciences (3 programs, 69 graduates)
Sociology, Anthropology and Political Science Studies
| Program Name | Graduates | Gender Distribution | Award Levels | CIP Code |
|---|---|---|---|---|
| Political Science and Government | 33 |
|
Bachelor's
|
45.1001 |
| Sociology | 19 |
|
Bachelor's
|
45.1101 |
| Economics | 17 |
|
Bachelor's
|
45.0601 |
Admission Requirements & Test Scores
Comprehensive overview of admission criteria, standardized test score ranges, and application requirements for prospective students at Quinnipiac University (QU).
Application Requirements
Data based on IPEDS for 2022-2023 academic year. Test score ranges represent the middle 50% of admitted students (25th-75th percentile). Requirements may vary by program.
Tuition, Fees & Estimated Costs
Overview of tuition rates, housing, and other annual education expenses for undergraduate and graduate students
Financial Aid & Student Support
Summary of scholarships, grants, student loans, and financial aid statistics for undergraduate students
Student Success Metrics
Graduation rates and post-graduation earnings to help assess student outcomes and long-term value of education.
Loan Burden & Repayment Outcomes
Breakdown of loan repayment rates and student debt levels by income and dependency status.
Frequently Asked Questions
Find answers to the most common questions about Quinnipiac University (QU)
How much does it cost to attend Quinnipiac University (QU)?
The annual tuition at Quinnipiac University (QU) is $53,090 for in-state students. When including room and board, books, and other expenses, the total estimated cost is approximately $73,320 for in-state students. Additional costs include room and board $16,470 (on) / $15,260 (off) and books and supplies $1,100.
Data based on IPEDS program completions for 2022-2023 academic year. Tuition and cost estimates are approximate and may not include all fees, personal expenses, or transportation costs.
What academic programs and degree levels does Quinnipiac University offer?
Quinnipiac University (QU) offers 79 academic programs across 24 major fields of study, with available degree levels: Bachelor's, Postbac Cert., Master's, Post-Master's, Doctorate (Professional).
Most popular program areas include:
- Healthcare Professions, Medical Sciences and Clinical Practice (19 programs)
- Business Administration, Marketing and Entrepreneurship (9 programs)
- Media Communications, Journalism and Public Relations (5 programs)
- Educational Sciences, Teaching Methods and Pedagogy (6 programs)
- Fine Arts, Design Studies and Creative Performance (4 programs)
Data based on IPEDS program completions for 2023-2024 academic year. Numbers reflect programs where students graduated, not all offered programs.
What is the acceptance rate for Quinnipiac University?
Quinnipiac University (QU) has an 77% acceptance rate and a 10.9% yield rate, making it selective.
Admission statistics breakdown:
- Total applicants: 21,323
- Students admitted: 16,418
- Students enrolled: 1,797
Data based on IPEDS for 2022-2023 academic year. Admission statistics may vary by program and application cycle.
What financial aid and scholarships are available at Quinnipiac University?
Quinnipiac University (QU) provides financial aid to 26% of first-time, full-time students, with average grants of $30,035 and average loans of $13,050.
Average financial aid amounts by type:
- Pell grants: $5,142
- State/Local grants: $4,971
- Institutional grants: $28,224
- Federal loans: $5,325
The university supports 1,604 students with grants and 1,064 students with loans annually.
Data based on IPEDS for 2022-2023 academic year. Financial aid amounts and percentages may vary by program, enrollment status, and individual circumstances.
What is the average salary for Quinnipiac University graduates?
Quinnipiac University (QU) graduates earn a median salary of $65,744 after 6 years and $83,759 after 10 years.
The salary range 10 years after graduation spans from $57,610 (25th percentile) to $112,458 (75th percentile).
Data based on IPEDS for 2022-2023 academic year. Salary data reflects graduates who received federal financial aid (approximately 60% of all graduates). Actual earnings may vary significantly based on program, location, and individual circumstances.
Related Universities


Found something useful? Help others discover it too! Share with friends, on social media, or save for later - every share helps someone find the information they need.